Jahresstatistiken und -diagramme

|
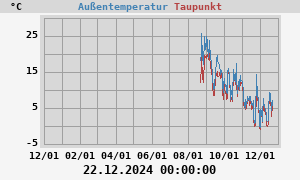
Temperatur max. Temperatur min. |
23,0°C um 08.04.2026 15:16:06 -8,3°C um 11.01.2026 08:09:49 |
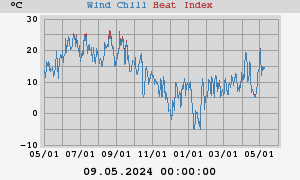
| Hitzeindex max. | 22,0°C um 08.04.2026 15:16:06 |
| Wind-Chill min. | -8,8°C um 05.01.2026 04:37:04 |
|
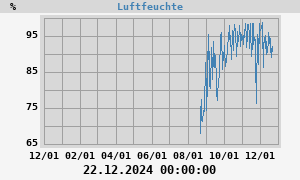
Luftfeuchte max. Luftfeuchte min. |
96% 22.02.2026 05:08:48 24% 08.04.2026 15:07:50 |
|
Taupunkt max. Taupunkt min. |
11,1°C 22.02.2026 11:44:00 -9,6°C 11.01.2026 08:32:29 |
|
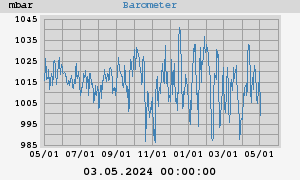
Luftdruck max. Luftdruck min. |
1029,9 mbar um 29.03.2026 10:30:00 975,0 mbar um 12.02.2026 06:30:00 |
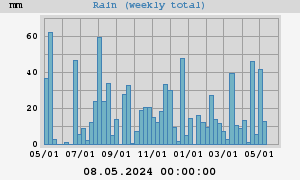
| Regen gesamt | 205,2 mm |
| Regenrate max. | 16,8 mm/h um 16.02.2026 10:44:42 |
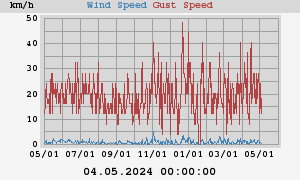
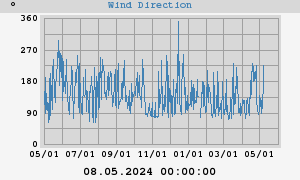
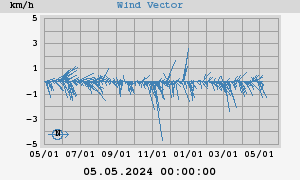
| Wind max. | 60 km/h aus 004° um 13.03.2026 08:35:13 |
| Durchschn. Wind | 1 km/h |
| Wind Effektivwert | 2 km/h |
|
Durchschn. Windstärke Durchschn. Windrichtung |
1 km/h 355° |
|
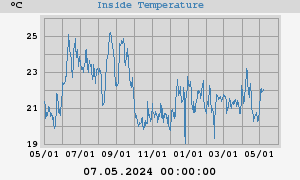
Innentemp. max. Innentemp. min. |
23,7°C um 17.01.2026 22:15:46 19,0°C um 29.03.2026 06:07:48 |
| Regen gesamt | 205,2 mm |
| Regenrate max. | 16,8 mm/h um 16.02.2026 10:44:42 |